2021 Census ethnicity language nationality and religion
Data on ethnicity, language, national identity and religion from the 2021 census was published by The Office for National Statistics on 29 November 2022. This report summarises the main points of the data for Luton.
- The overall population of Luton increased by 22,000 people between 2011 and 2021, a rise of 11 per cent.
- The 2021 census showed that the population of Luton now has a non-white majority with 54.8 per cent of the population being non-white.
- Luton is one of four authorities outside of London with the majority of the population being from ethnic minority groups. Slough has the largest non-white population at 64.1 per cent with Leicester at 59.1 per cent, Birmingham also having an ethnic minority majority of 51.4 per cent of the population.
- White British make up 31.8 per cent of the population of Luton compared with 74.4 per cent nationally.
- The percentage of people with English as their first language in Luton is 76.5 per cent which is one of the smallest proportions in the country.
- Of the population of Luton, 74.9 per cent have a UK identity compared with 88 per cent nationally.
- The number of people reporting as Christian is still the largest group in Luton but the number of Christians fell by 11.4 per cent from 96,271 in 2011 to 85,297 in 2021.
- The numbers of Muslims increased from 49,991 to 74,191 in the last decade, an increase of 48.4 per cent.
The population of Luton now has a non-white majority with 54.8 per cent of the population being non-white. Luton is one of four places outside of London with the majority of the population being from ethnic minority groups.
Slough has the largest non-white population at 64.1 per cent, Leicester is 59.1 per cent with Birmingham also having an ethnic minority majority of 51.4 per cent of the population.
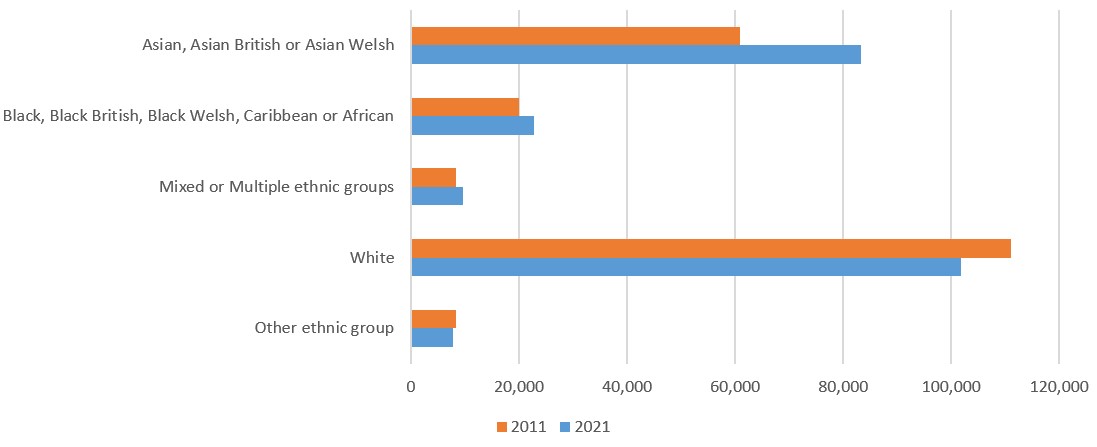
White ethnicity (including other than White British) remained the largest high level ethnic group but the numbers have fallen since 2011, from 111,079 to 101,798. The white ethnic group makes up 45.2 per cent of the population of Luton meaning there is a non-white majority in the town.
The next largest ethnic group is Asian which increased from 60,952 in 2011 to 83,325 in 2021. The Asian group makes up 37 per cent of the population of Luton. The Black ethnic group is now 22,735, increasing from 19,909 in 2011. The Black ethnic groups makes up 10.1 per cent of the population of Luton.
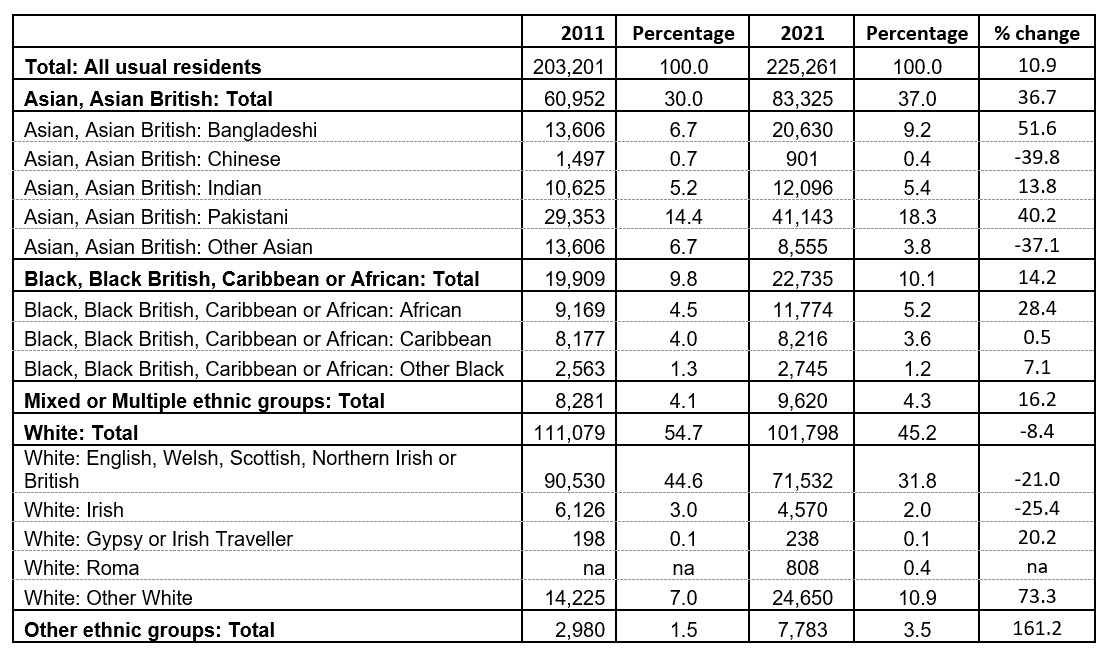
Luton’s overall population increased by 22,000 between 2011 and 2021. Table 1 shows that the proportion of White British in Luton is now 31.8 per cent which is 71,532 people. The number of Asian British people at 83,325 is now larger than the number of White British in the town.
The Other White category which includes people from Eastern Europe is now 24,560, the increase being driven by the number of Romanians who have settled in the town over the last decade. Luton is a ‘super-diverse’ town with numerous ethnic minority groups.
In Luton the percentage of people with English as their first language is 76.5 per cent. This is 165,995 people. The authority with the smallest proportion of people whose first language is Newham with 65.4 per cent. Outside of London only Slough and Leicester have a larger proportion of people whose first language is not English
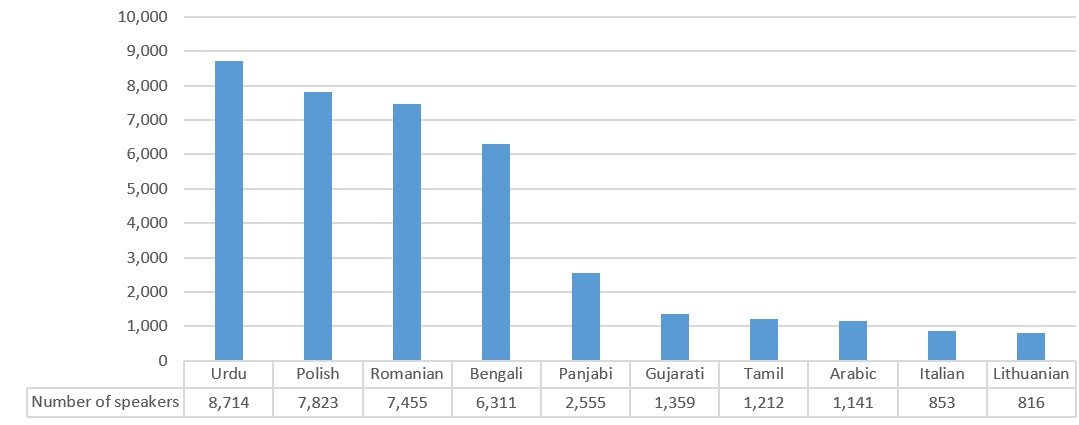
Of Luton’s residents:
- 8,714 have Urdu as their first language (3.9 per cent)
- 7,823 have Polish as their first language (3.5 per cent)
- 7,455 have Romanian as their first language (3.3 per cent)
- 6,311 have Bengali as their first language (2.8 per cent)
- Panjabi, Gujarati, Tamil, Arabic, Italian and Lithuanian are also widely spoken in the town
- The census recorded over 100 different languages other than English as people’s main language
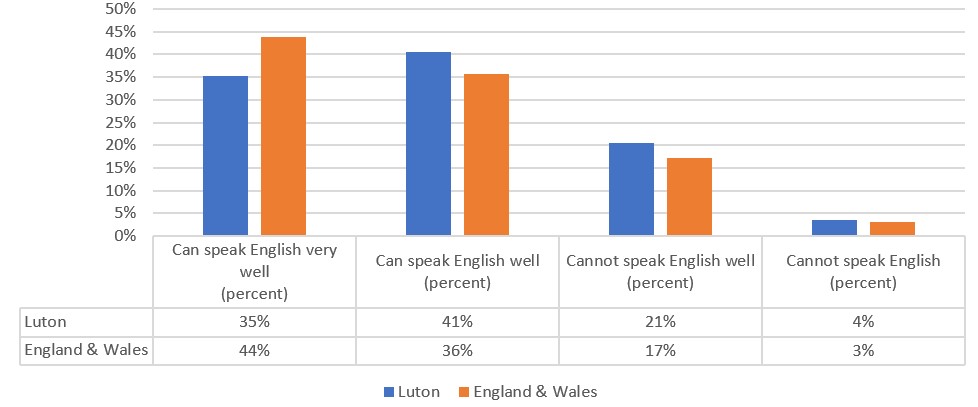
In Luton 20.5 per cent of the population cannot speak English well and 3.6 per cent of the population cannot speak English. This is larger than the national figure for England and Wales of 17.1 per cent and 3.1 per cent respectively.
The census question on national identity was introduced in 2011 because of increased interest in ‘national’ consciousness and a demand for people to be able to acknowledge their national identity. The question allows respondents to select all identities that apply. The term ‘only’ is used throughout the article to refer to respondents classified with a single national identity.
In Luton:
- 74.9 per cent of the population have one or more UK identity compared to 88 per cent nationally.
- 3 per cent have a UK and a non UK identity compared to 2 per cent nationally.
- 22.2 per cent have a non UK identity compared to 10 per cent nationally.
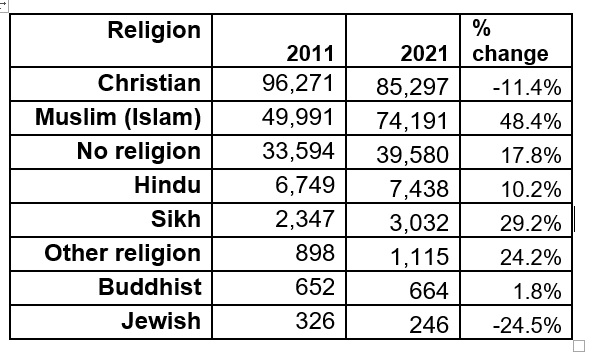
The number of people reporting as Christian is still the largest group in Luton but the number of Christians fell by 11.4 per cent from 96,271 in 2011 to 85,297 in 2021. The numbers of Muslims increased from 49,991 to 74,191 in the last decade, a rise of 48.4 per cent. The number of people with no religion increased from 33,594 to 39,580 in the last decade, a rise of 17.8 per cent.
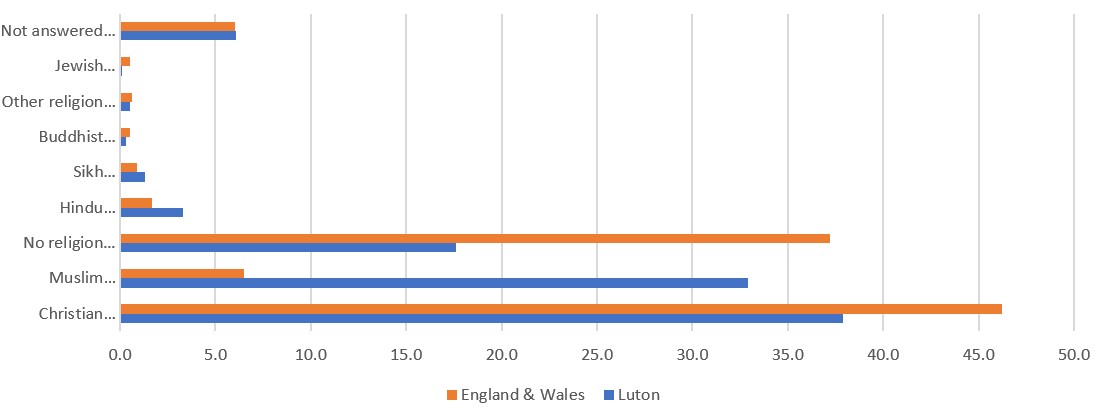
When compared with England and Wales there is a larger proportion of Muslims in Luton, 32.9 per cent compared with 6.5 per cent. There is a smaller proportion of Christians, 37.9 per cent compared with 46.2 per cent and people with no religion, 17.6 per cent compared with 37.2 per cent.
More census analysis will be added to the Luton information observatory page as data is published.
 358.7 kB