2021 Census housing
Data on housing from the 2021 census was published by the Office for National Statistics in January 2023. This report summarises the main points of the data for Luton.
- The number of households who are privately renting in Luton has grown significantly in the last decade and the proportion of households privately renting is well above the national figure.
- The number of people who own their home in Luton with a mortgage or loan has fallen in the last decade but the numbers who own their home outright has increased.
- The number of households socially renting in Luton increased between 2011 and 2021 which differs from the national trend.
- In Luton 12 per cent of households are measured as being overcrowded in comparison to the 4 per cent national figure.
- The wards with the highest levels of over-crowding are Dallow, Biscot, South, High Town and Saints.
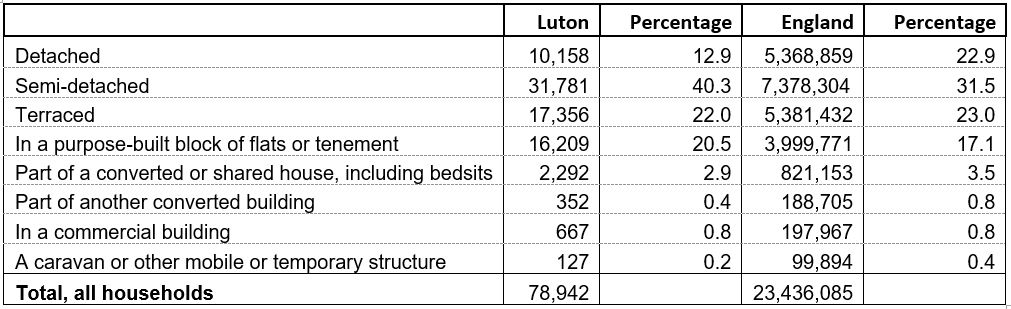
Table 1 shows that Luton has a larger proportion of people living in semi- detached housing and flats than the national average with a smaller proportion of people living in detached houses.
Tenure is whether a household rents or owns the accommodation that it occupies. Households that rent their accommodation were asked what type of landlord owns or manages it.
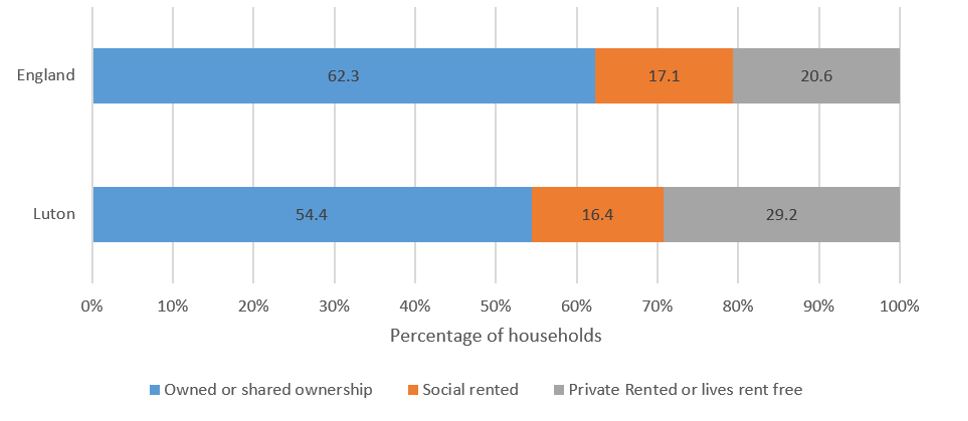
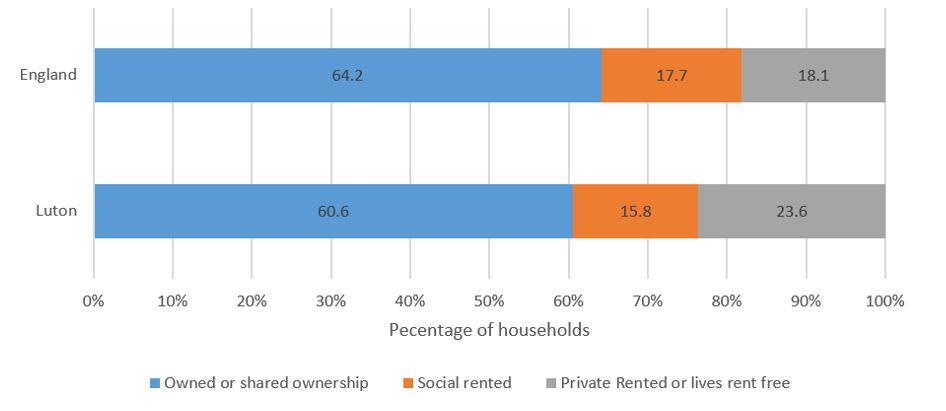
Figures 1 and 2 show that the proportion of people who own their own homes has fallen in Luton and England between 2011 and 2021, with a decrease in Luton from 60.6 per cent to 54.4 per cent and a decrease in England from 64.2 per cent to 62.3 per cent. The proportion of people privately renting in Luton increased from 23.6 per cent to 29.2 per cent in the last decade with an increase from 18.1 per cent to 20.6 per cent nationally. Luton differed from the national trend with a small increase in the proportion of people socially renting.
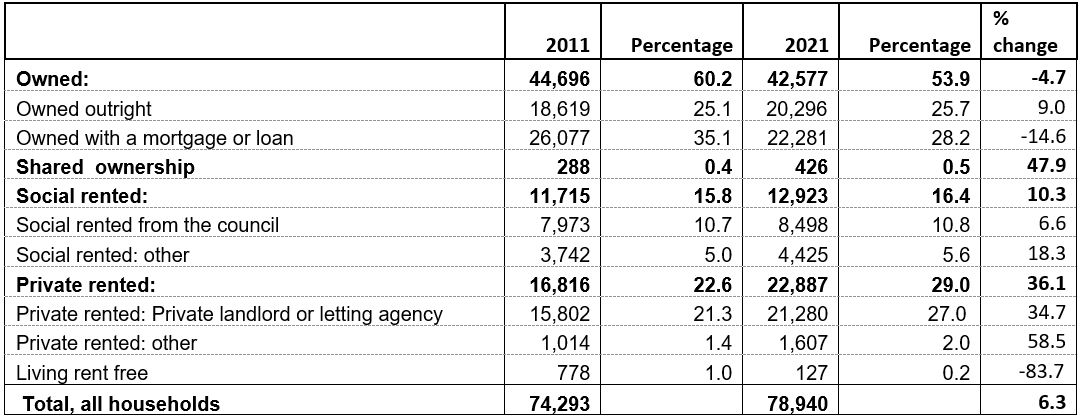
The data on accommodation ownership and renting can be broken down further to show that:
- 25.7 per cent of households (20,296) owned the accommodation they lived in outright, an increase from 25.per cent (18,619) in 2011
- 28.2 (22,281) owned their accommodation with a mortgage or loan, which is a smaller proportion than in 2011 (35.1 per cent, 26,077)
- 29 per cent (22,887) rented their accommodation privately, up from 22.6 per cent (16,816) in 2011
- 16.4 per cent (12,923) were in the social rented sector, for example through a local council or housing association; this is a larger proportion than in 2011 (15.8 per cent, 11,715)
Luton is ranked as having the 30 highest proportion of households privately renting out of 331 local authorities in England and Wales.
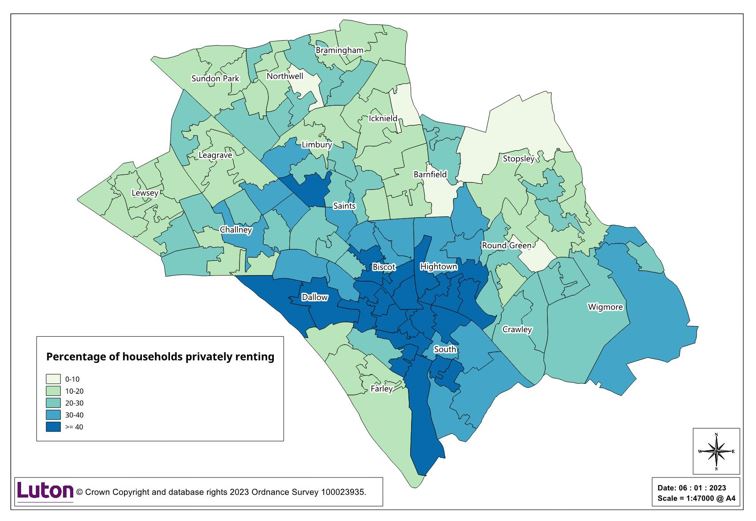
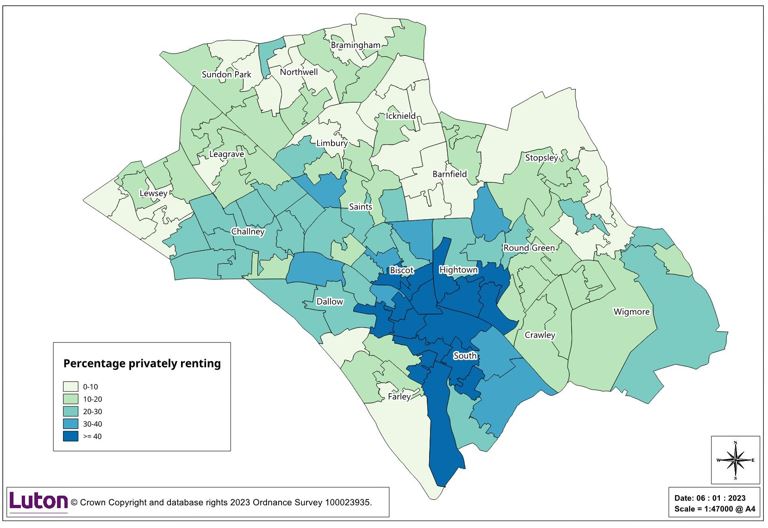
Figures 3 and 4 show the proportion of people in lower layer super output areas (LSOA) who are privately renting in Luton. The darker areas are where larger numbers of people privately rent. The numbers have grown over the past decade and more than 40 per cent of people are privately renting in parts of South, Biscot, Dallow, Farley, High Town and Saints wards.
The occupancy rating provides a measure of whether a household’s accommodation is overcrowded or under-occupied. An occupancy rating of negative 1 or less implies that a household has fewer bedrooms than the standard requirement, positive 1 implies that they have more bedrooms than required, and 0 implies that they met the standard required.
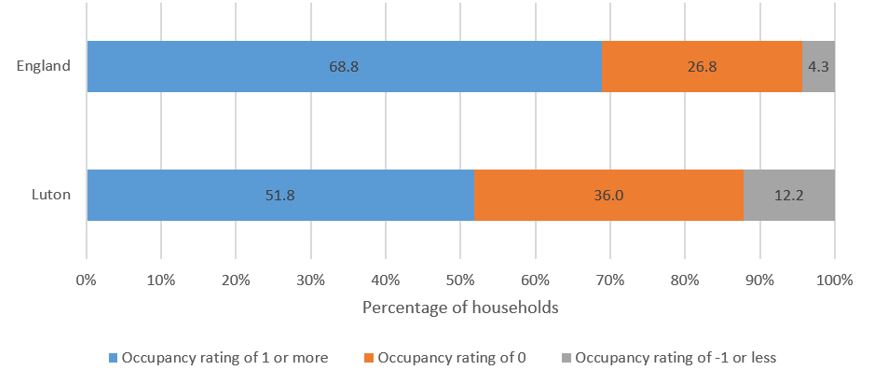
In Luton 12.2 per cent of households have fewer bedrooms than the standard required in comparison to 4.3 per cent nationally with 51.8 per cent having more bedrooms required compared with 68.8 per cent nationally. These figures show that over-crowding in Luton is above the national average.
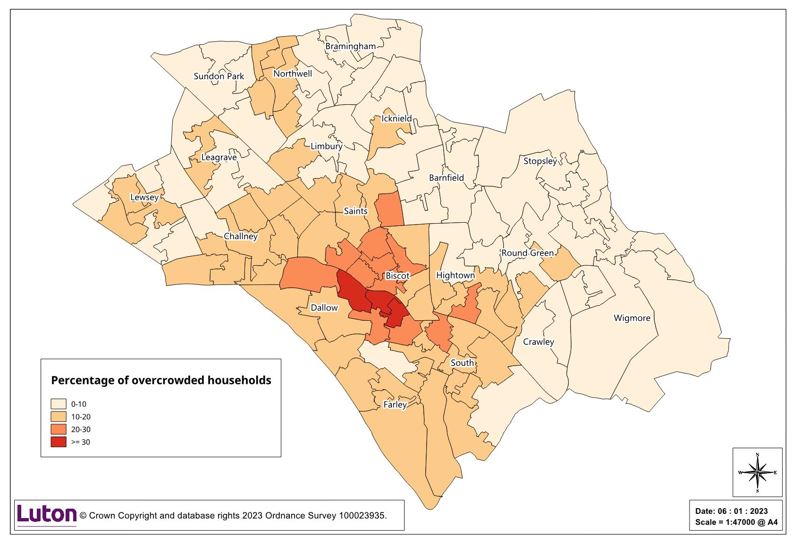
Figure 5 shows that in parts of Dallow ward more than 30 per cent of households are over-crowded. High Town, Biscot, South and Saints wards have areas with more than 20 per cent of households being over-crowded.
As in previous censuses, Census 2021 asked households how many cars or vans the household owned or had available to them.
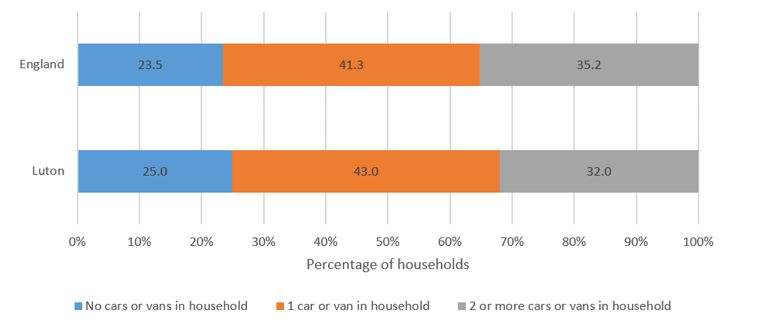
Figure 6 shows that Luton has a slightly higher proportion of households without cars than nationally, 25 per cent compared with 23.5 per cent, but levels of car ownership are similar to the national figure.
More census analysis will be added to the Luton information observatory page as data is published.
 770.4 kB